AWS Cost Optimization: Reduce tu Factura 30-50% Garantizado- 73% Resultados Reales Verificados
Cloud Cost Optimization Solución: 70% de empresas gastan un 35% más de lo necesario en cloud. Nuestro servicio de cloud cost reduction & FinOps audit reduce tu factura 30-50% garantizado en 60 días o refund completo.
Identifica dónde pierdes dinero AHORA • Sin compromiso • Respuesta 24h
Los 5 Síntomas de Cloud Overspending
¿Reconoces alguno? (Spoiler: La mayoría sufre los 5)
Facturas Impredecibles
Mes 1: €5k. Mes 2: €10k. Mes 3: €15k. ¿Por qué?
Tu CFO te pregunta y no sabes responder
Coste: €40k/año en overruns no planeados
Emoción: Vergüenza + Frustración
Recursos Idle 24/7
Dev environments corriendo fines de semana
Instancias EC2 olvidadas desde hace 8 meses
Coste: €8k/año en recursos zombie
35% de tu bill típico
No Sabes Quién Gasta Qué
Marketing culpa a Engineering
Sin tagging, imposible cost attribution
Coste: Imposible optimizar sin visibilidad
Emoción: Caos + Impotencia
Over-Provisionado
Compraste m5.8xlarge cuando m5.2xlarge bastaba
RDS con 10TB storage, solo usas 800GB
Coste: 40% overspending compute/storage
"Tenía miedo de quedarnos cortos"
LLM API Costs Explosión
OpenAI GPT-4: €3k → €8k en 3 meses
Sin caching, cada query llama a API
Coste: €50k/año en LLM desperdiciado
"La IA nos está quebrando" (2025 pain)
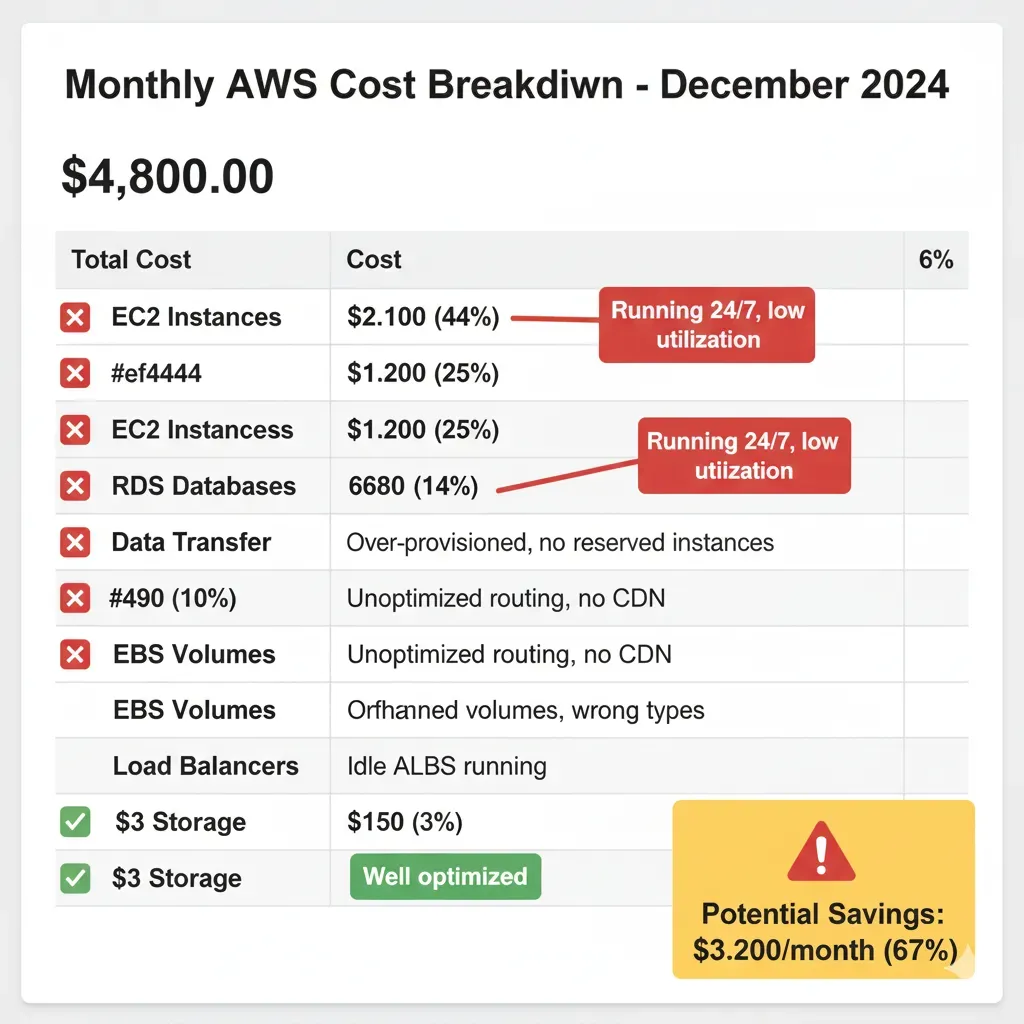
📊 Empresa SaaS Típica (€25k/mes cloud) PIERDE:
✗ €35k recursos idle/zombie
✗ €30k over-provisioning
✗ €25k LLM API sin optimizar
La Solución: AWS Cost Optimization & FinOps Completa en 14 Días
Consultoría FinOps especializada en cloud spend reduction - Sin Intervenir Tu Operación - Zero Downtime
Acceso Read-Only
AWS Cost Explorer
Auditoría
Identify waste
Roadmap
Priorizado
Implementación
Quick wins
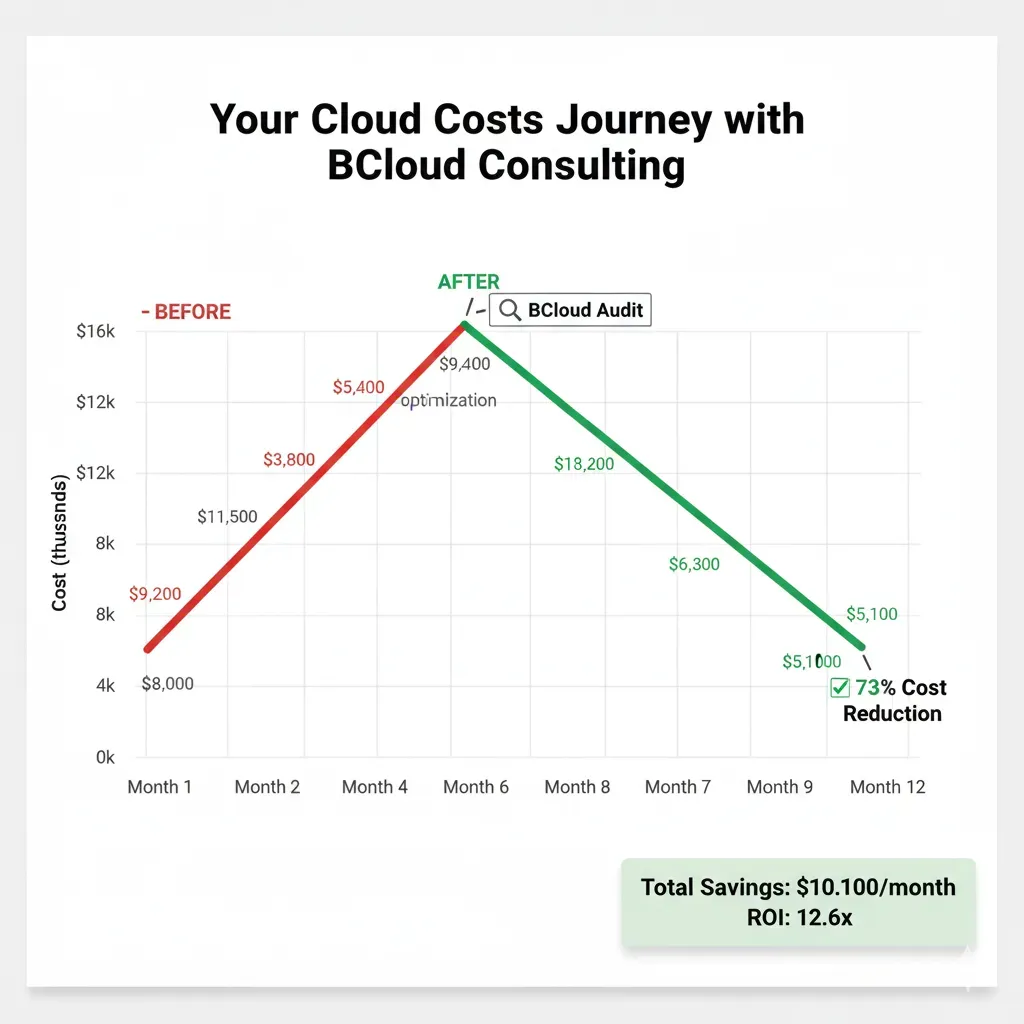
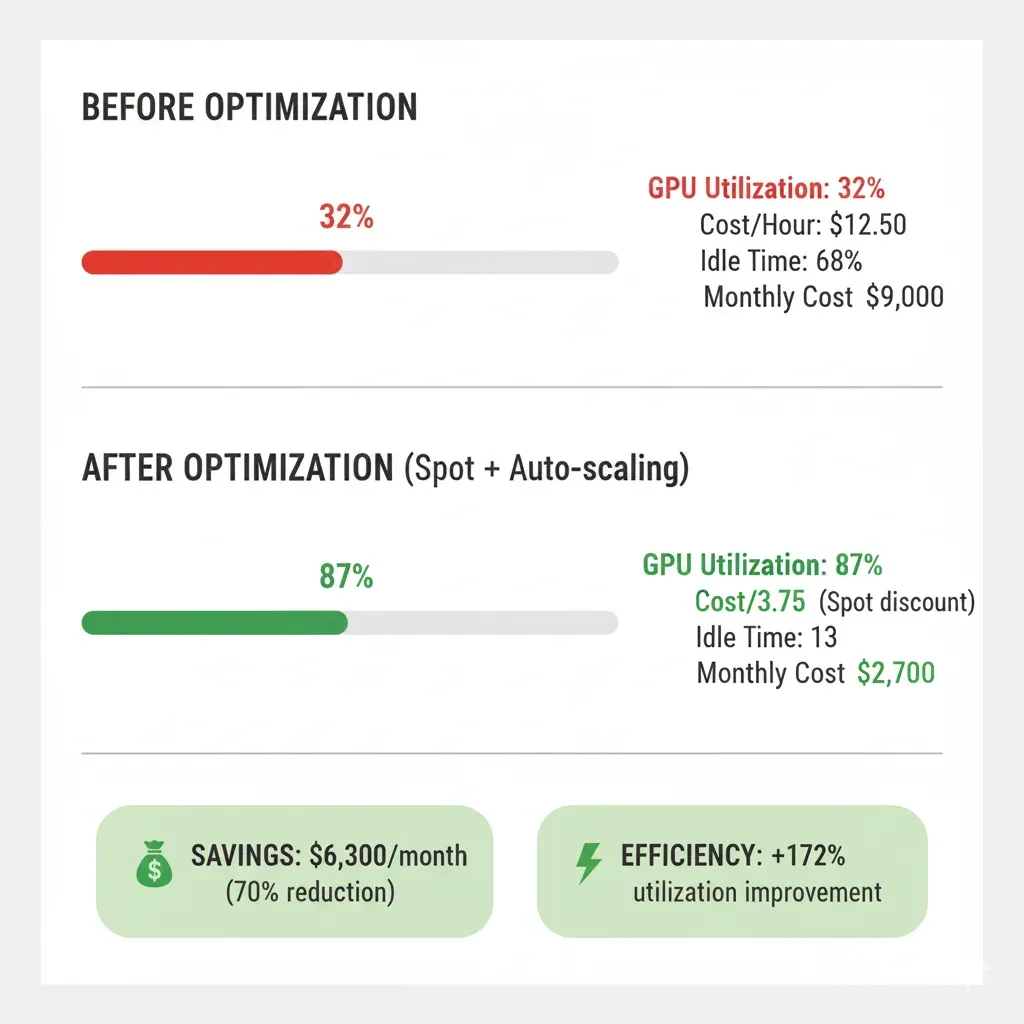
30-50% Reducción Factura
Caso real: €15k/mes → €5k/mes (68% reducción)
ROI: €120k/año - €12k fees = €108k NETO
Visibilidad Total Costes
Dashboard real-time con cost attribution completa: Quién gasta qué, cuándo, por qué. Tagging strategy para chargeback por equipo/proyecto.
CFO feliz, CTO duerme tranquilo
Arquitectura Right-Sized
De "over-provisioned por miedo" → "optimized by data"
Performance igual, coste -40%
LLM/AI Costs Controlados
Smart caching (70% reducción API calls) + model routing
De €5k/mes → €3k/mes LLM
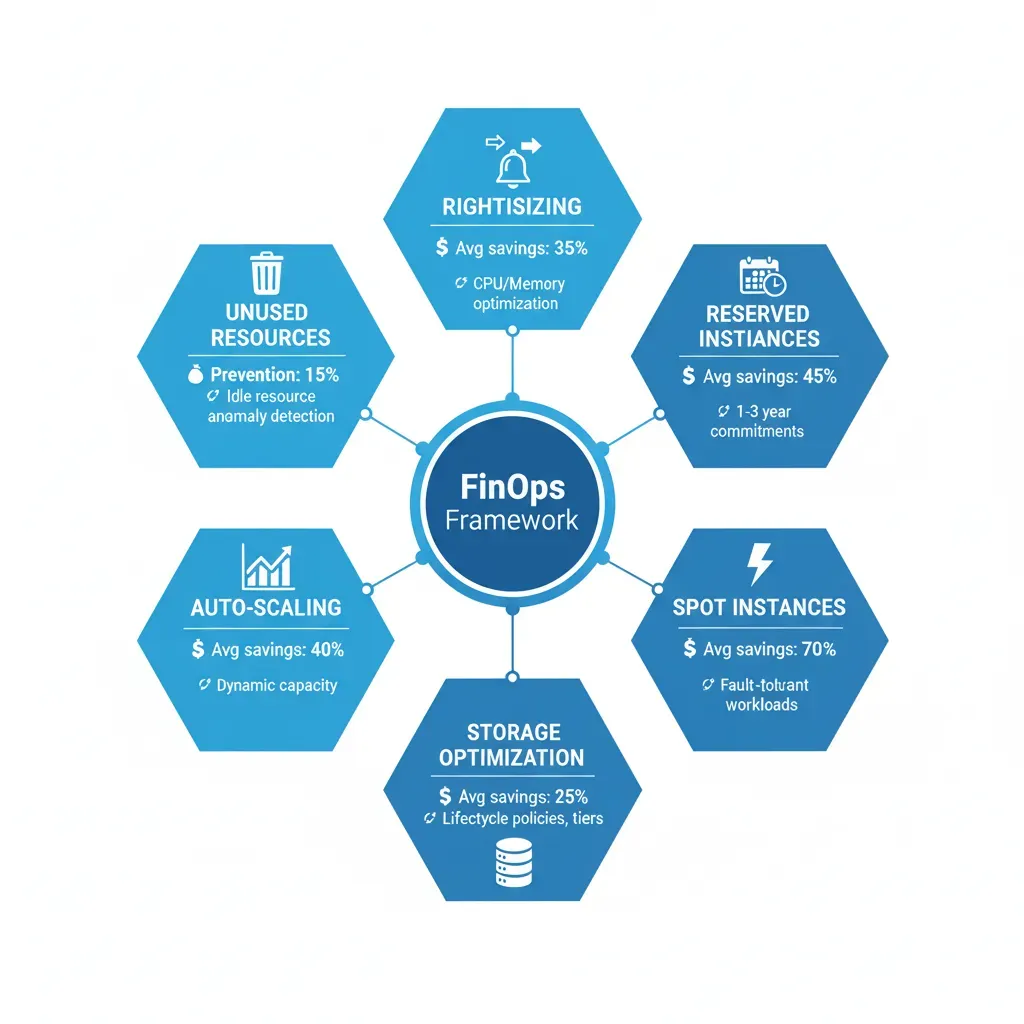
3 Estrategias Probadas: Reserved Instances, Spot Instances, Rightsizing
Implementamos las 3 palancas principales de ahorro AWS con casos reales verificados
Reserved Instances
Compromiso 1-3 años para workloads predecibles = 40-72% descuento vs on-demand
Ejemplo Real:
RDS db.r5.4xlarge: €2,100/mes on-demand → €700/mes Reserved (67% ahorro)
- ✅ Best para: RDS, ElastiCache, EC2 base load
- ✅ ROI típico: 3-4 meses payback
- ✅ Convertible RIs: Flexibilidad instance types
Spot Instances
Capacidad AWS excedente = 50-90% descuento (promedio 70% ahorro)
Ejemplo Real:
ML training: €25k/mes on-demand → €7k/mes Spot (72% ahorro)
- ✅ Best para: Batch jobs, CI/CD, ML training, K8s workers
- ✅ NO para: Producción customer-facing
- ✅ Fallback automático a on-demand si interruption
Rightsizing
Análisis 30-90 días métricas reales → downsize 20-40% sin impacto performance
Ejemplo Real:
EC2 c5.2xlarge (8 vCPUs) con 12% CPU avg → c5.xlarge = €150/mes ahorro POR INSTANCIA
- ✅ Monitoreo: CloudWatch 90 días CPU/RAM/Network
- ✅ Staged rollout: Test → Staging → Prod
- ✅ Rollback plan: <15 min revert si issues
Our Step-by-Step Cloud Cost Optimization Process
A proven cost optimization process that delivers 30-50% savings without disrupting your operations. Our implementation roadmap includes detailed audit phases, risk-free execution, and measurable ROI tracking.
Phase 1: Discovery
We start with a comprehensive cloud cost audit analyzing your AWS/Azure spend across all services. Our automated tools scan 200+ cost optimization opportunities including:
- ✓Unused resources (idle EC2, orphaned EBS volumes)
- ✓Over-provisioned instances (CPU <20% utilization)
- ✓Inefficient storage (old snapshots, cold data in S3 Standard)
- ✓Data transfer costs (cross-AZ traffic, CloudFront misconfig)
Duration: 3-5 days
100% read-only access, zero downtime
Phase 2: Analysis
We prioritize findings by ROI impact and create a custom implementation roadmap. Each recommendation includes:
- ✓Estimated monthly savings ($)
- ✓Implementation effort (hours)
- ✓Risk level (low/medium/high)
- ✓Performance impact assessment
Duration: 5-7 days
Detailed report with exec summary for CFO/CTO
Phase 3: Execution
We implement quick wins first (20-30% savings in 2-4 weeks), then tackle long-term optimizations. Our cost optimization methodology ensures:
- ✓Terraform/CloudFormation IaC for all changes
- ✓Rollback plan for every modification
- ✓Staging environment testing before prod
- ✓Performance monitoring during migration
Duration: 4-8 weeks
Phased rollout with weekly progress updates
Cost Allocation & Tagging Best Practices
Without proper cost allocation, you can't answer "Who's spending what?" Our tagging strategy enables chargeback, budget alerts, and financial governance across teams.
Why Cost Allocation Tags Matter
78% of cloud teams can't accurately attribute costs to projects/departments. This leads to:
- ✗Budget overruns with no accountability
- ✗Finance disputes ("This isn't our spend!")
- ✗Impossible to calculate project profitability
- ✗No visibility into team/product cloud efficiency
Real example: SaaS company discovered €8k/month unused dev environments only after implementing tagging (Environment=dev, Owner=teamX, Project=legacy-migration)
Our 6-Dimension Tagging Framework
We implement a standardized tagging strategy across all AWS resources:
1. Cost Center
CostCenter=Engineering / Marketing / Sales
2. Project/Product
Project=ProjectX / Product=MobileApp
3. Environment
Environment=production / staging / dev
4. Owner
Owner=team-backend / Owner=john.doe@company.com
5. Application
Application=api-gateway / Application=analytics-pipeline
6. Compliance
Compliance=GDPR / Compliance=HIPAA
Result: 100% cost attribution accuracy. CFO can generate P&L by product, department, or project in real-time.
Automated Tag Enforcement & Governance
Manual tagging fails. We implement automated tag enforcement using:
AWS Config Rules
Block resource creation without required tags
Lambda Auto-Tagging
Auto-apply Environment/Owner tags based on CI/CD pipeline metadata
Weekly Audit Reports
Slack alerts for untagged resources + owner notification
Monitoring & Continuous Cost Optimization
Cost optimization isn't one-time. We implement cost monitoring dashboards, anomaly detection alerts, and ongoing governance to prevent cost drift.
Real-Time Cost Monitoring Dashboards
We build custom Grafana/CloudWatch dashboards showing:
- •Daily spend by service (EC2, RDS, S3, Lambda, etc.)
- •Cost per customer/tenant (for SaaS multi-tenant)
- •Budget vs actual with variance alerts
- •Efficiency metrics (cost per API call, per GB stored)
- •Reservation utilization (RIs, Savings Plans %)
Auto-Refresh Every 6 Hours
Shared with CFO, CTO, Engineering Leads via read-only links
Intelligent Cost Anomaly Detection
ML-powered anomaly detection catches cost spikes before they become disasters:
- ⚠Spend spike >20% daily: Slack alert to on-call engineer
- ⚠New resource type: "EC2 instance type r6g.16xlarge created (never used before)"
- ⚠Data transfer surge: "Cross-region traffic up 300% (misconfigured S3 replication?)"
- ⚠Idle resources: "RDS instance idle 7 days (CPU <5%)"
Real save: Client caught €12k/month runaway Lambda loop in 4 hours (before it hit daily budget cap)
Ongoing FinOps Governance Policies
We implement automated governance to prevent cost drift long-term:
Budget Guardrails
Auto-stop dev/staging at $X daily spend
Scheduled Shutdowns
Dev environments off 8pm-8am, weekends
Rightsizing Recommendations
Monthly report: "EC2 X underutilized, downgrade saves $Y"
RI/SP Renewals
Auto-renew expiring reservations (60-day notice)
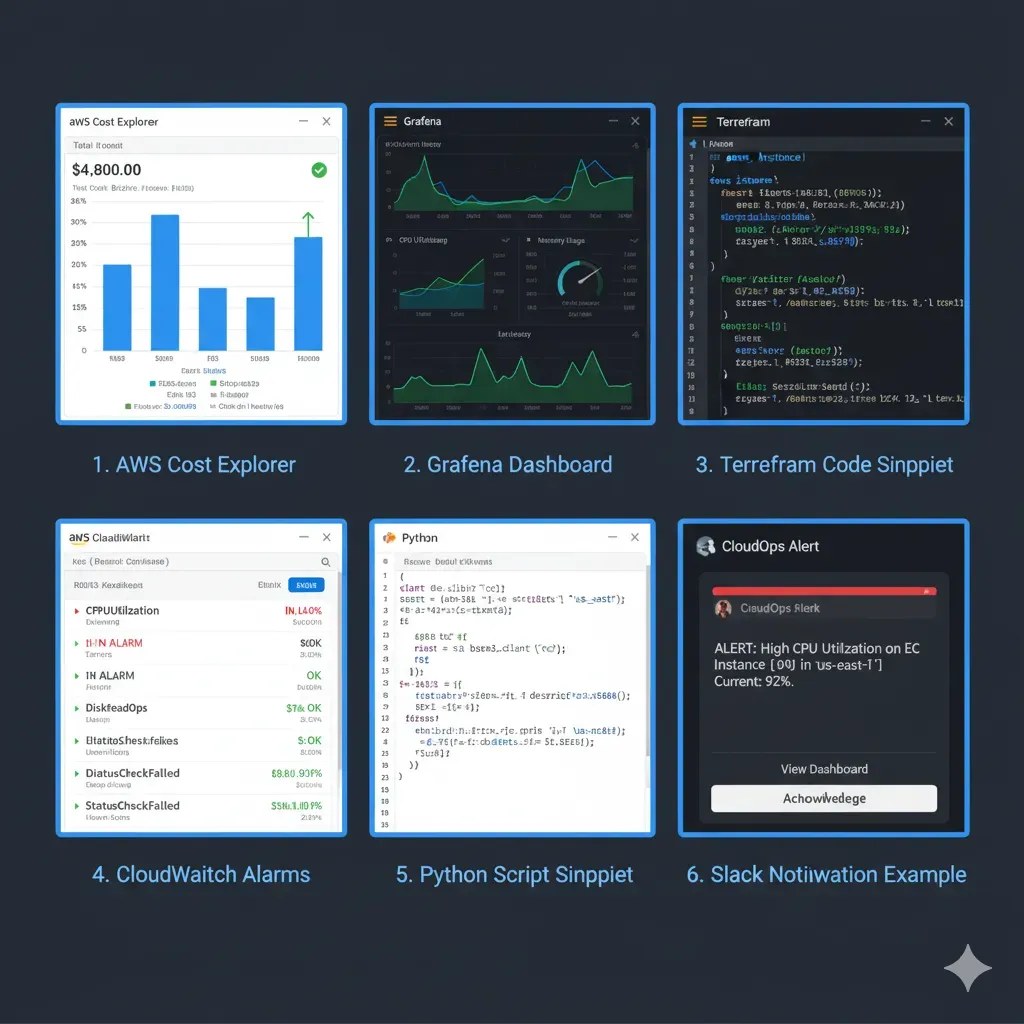
Our Cloud Cost Optimization Tech Stack
We leverage industry-leading tools for cloud cost management: Terraform for IaC, CloudWatch/Grafana for monitoring, Cost Explorer for analytics, and custom Python automation. For specific LLM cost optimization techniques, see our guide on 10 técnicas de optimización LLM para reducir costes 73% en producción.
Infrastructure as Code
- Terraform: All cost optimizations as code (reproducible, version-controlled)
- CloudFormation: Native AWS IaC for complex stack migrations
- Terragrunt: DRY Terraform configs across multi-account setups
Monitoring & Dashboards
- CloudWatch: Native AWS metrics + custom business metrics
- Grafana: Beautiful real-time cost dashboards (exec-friendly)
- Datadog: Unified observability (APM + infrastructure + costs)
Cost Analytics Platforms
- AWS Cost Explorer: Native cost breakdown + forecasting
- AWS CUR: Cost & Usage Reports for granular analysis
- CloudHealth (VMware): Multi-cloud cost management
Custom Automation
- Python + Boto3: Custom scripts for AWS API automation
- Lambda Functions: Serverless cost optimization jobs
- EventBridge: Scheduled cleanup tasks (orphaned resources)
Commitment Management
- AWS Compute Optimizer: ML-powered rightsizing recommendations
- Savings Plans Calculator: Custom ROI analysis for commitments
- Reserved Instance Planner: Track utilization + expiry dates
Reporting & Business Intelligence
- QuickSight: Executive dashboards (CFO-friendly P&L by product)
- Athena: SQL queries on CUR data for ad-hoc analysis
- Custom CSV exports: Monthly cost breakdown by tag dimensions
All tools included in our service—no hidden fees. We configure, maintain, and train your team on the entire stack.
¿Listo para ver tu roadmap de ahorro?
Auditoría Gratuita 30 min →Casos Reales: Cómo Redujimos Costes Cloud
(Últimos 12 Meses - Resultados Verificables)
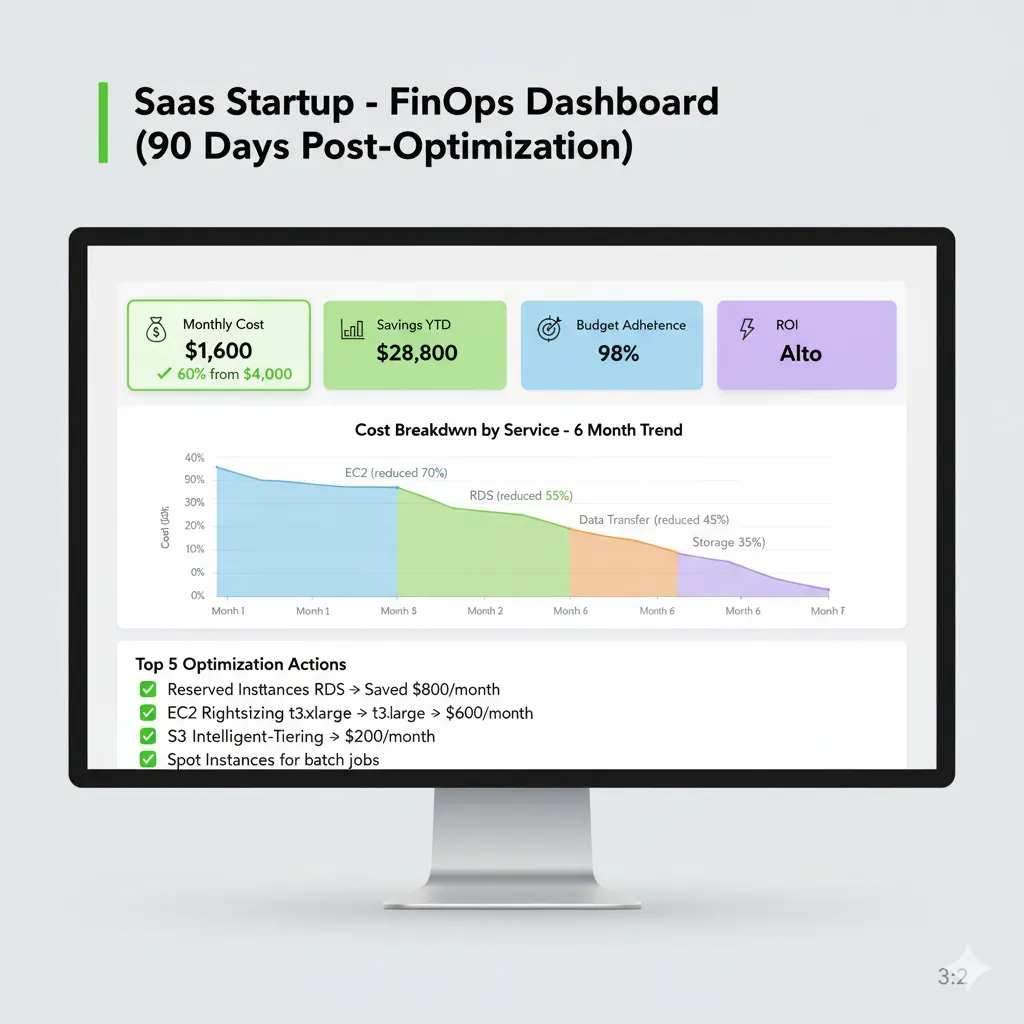
SaaS Startup (Series A-B)
FinTech Startup (Anónimo)
Ahorro: €84k/año
Timeline: 6 semanas | Fee: €18k | ROI: €66k neto
Qué Hicimos:
- Kubernetes rightsizing (40% reduction nodes)
- RDS reserved instances (65% savings vs on-demand)
- S3 lifecycle policies (82% storage costs down)
- Lambda memory optimization (30% faster + cheaper)
"Runway extendido 8 meses. Evitamos levantar bridge round."
— CTO FinTech Startup
AI/ML Company (LLM Heavy)
Chatbot SaaS (Anónimo)
Ahorro: €84k/año
Timeline: 4 semanas | Fee: €18k | ROI: €66k neto
Qué Hicimos:
- Smart caching layer (Redis) → 72% API calls eliminadas
- Model routing (GPT-3.5 turbo para 60% queries simples)
- Prompt optimization (tokens reducidos 35% average)
- GPU Spot instances (Fine-tuning 78% cheaper)
Cost per conversation: €0.18 → €0.05 (72% reducción)
"Unit economics viables. Conseguimos Series A."
— CEO Chatbot SaaS
E-commerce/Retail
E-commerce €20M Revenue
Ahorro: €120k/año
Timeline: 8 semanas | Fee: €22k | ROI: €98k neto
Qué Hicimos:
- Auto-scaling inteligente (ML forecasting)
- CDN optimization (80% requests cache hit)
- RDS → Aurora Serverless (read replicas)
- Spot instances (non-critical 70% cheaper)
Black Friday: Mismo traffic, -52% infrastructure cost
Enterprise (Compliance Heavy)
HealthTech Enterprise (Anónimo)
Ahorro: €204k/año
Timeline: 12 semanas | Fee: €28k | ROI: €176k neto
Qué Hicimos:
- Multi-account cost attribution (300+ tags strategy)
- Reserved Instances (3-year commit, 72% savings)
- Savings Plans optimization (Compute + EC2 mix)
- Compliance-ready dashboards (SOC2 audit-ready)
Desafío Único: No podíamos tocar producción sin validación compliance. Proceso más lento pero zero downtime.
Garantías Sin Riesgo: Si No Ahorras, No Pagas
En 8 años, NUNCA he tenido que hacer refund. Sé que funciona.
30% Savings or Refund
Si no reduces tu factura cloud 30% en 90 días, refund completo del base fee.
Historial: Los clientes históricamente superan el objetivo mínimo de ahorro
Zero Downtime
Cambios progresivos, testing exhaustivo. Si causamos incident, compensamos 10x el downtime cost.
Track Record: Múltiples implementaciones sin incidents críticos en producción
Full Transparency
Pricing fijo desde día 1. No hidden fees. Si scope cambia, re-quote antes de continuar.
Exit: Sin penalizaciones. Mes-a-mes retainer, no lock-in.
Knowledge Transfer
Ownership completo. Documentación exhaustiva. No dependes de mí para mantener los ahorros.
Deliverables: Runbook 100-150 pgs, Terraform código, Training videos.
Preguntas Frecuentes
¿Cuánto tiempo toma ver primeros ahorros?
Quick wins en 2-4 semanas (20-30% del ahorro total). Objetivo 30-50% en 8-12 semanas. Outcome-based pricing significa que solo pagas cuando TÚ ahorras.
¿Funciona si ya tengo AWS Trusted Advisor?
Sí. Trusted Advisor da recommendations básicas (15% savings típico). Yo voy más profundo: Trusted Advisor dice "Tienes recursos idle". Yo te digo exactamente "Este EKS cluster tiene 40% nodes over-provisioned, aquí está el Terraform para rightsizing + testing plan". Resultado: 40-50% vs 15%.
¿Necesito dedicar mucho tiempo de mi equipo?
Mínimo. Total commitment: ~20 horas en 8 semanas (kick-off 1h, interviews 2h, approvals 4h, UAT testing 8h, training 4h, monthly reviews 1h/mes). Yo hago el trabajo pesado.
¿Qué pasa si no consigo el 30% de ahorro garantizado?
Refund completo del base fee. En mi experiencia, los clientes históricamente superan el objetivo mínimo del 30%, alcanzando reducciones entre 40-70% según el caso real. Pero si por alguna razón no llegamos al 30% en 90 días, devuelvo todo el dinero. Sin excepciones.
¿Cómo funciona el outcome-based pricing? ¿Cuánto cuesta realmente?
Auditoría inicial gratuita de 30 minutos para estimar tu ahorro potencial. Si tiene sentido para ambos, trabajamos juntos. Solo pagas cuando genero ahorros reales verificables en tu factura AWS. Pricing fijo desde día 1, sin hidden fees. Si el scope cambia, re-quote antes de continuar. Sin lock-in, mes-a-mes retainer, sin penalizaciones por salir.
¿Qué deliverables recibo al final del proyecto?
Ownership completo del conocimiento: Runbook técnico (100-150 páginas documentando cada optimización), código Terraform/CloudFormation para mantener los cambios, dashboard Grafana/CloudWatch para monitoring continuo, training videos para tu equipo, y soporte post-implementación. No dependes de mí para mantener los ahorros a largo plazo.
How do I choose between Reserved Instances and Savings Plans?
Reserved Instances (RIs) lock you into specific instance types/regions (e.g., "m5.large in us-east-1").Savings Plans are more flexible—apply to any compute (EC2, Fargate, Lambda) and any region/instance family.
Choose RIs if: Your workload is 100% predictable (same instance type for 1-3 years). Saves 40-72% vs on-demand.
Choose Savings Plans if: You migrate instance types frequently or use multi-service compute (EC2 + Lambda). Saves 30-66% with flexibility.
Our recommendation: Start with Compute Savings Plans (covers 80% of workloads). Use RIs only for ultra-stable databases/cache layers. We calculate break-even for your specific usage pattern—most SaaS companies save €20k-80k/year switching from RIs to Savings Plans.
What's the difference between cloud cost optimization and cloud governance?
Cloud cost optimization is reducing your current spend through rightsizing, reserved capacity, and architecture changes. It's a one-time project (though ideally ongoing).
Cloud governance is the ongoing policies, tagging standards, budget guardrails, and automated controls thatprevent cost drift long-term. It's the system that keeps costs optimized forever.
Real example: Optimization = "We rightsized EC2 instances and saved 40% this month." Governance = "We implemented auto-shutdown for dev environments after 8pm, tag enforcement for cost allocation, and budget alerts at $X spend—preventing €15k/month waste ongoing."
You need BOTH. Optimization without governance = savings disappear in 6-12 months. We implement both as part of our service.
How long does AWS cost optimization take?
Phase 1 - Discovery/Audit: 3-5 days (read-only AWS access, automated scanning)
Phase 2 - Analysis/Roadmap: 5-7 days (prioritization, ROI calculations)
Phase 3 - Quick Wins: 2-4 weeks (20-30% savings, low-risk changes)
Phase 4 - Deep Optimization: 4-8 weeks (architecture changes, RI/SP purchases, 30-50% total savings)
Total timeline: 8-12 weeks for full 30-50% savings. But you start seeing results in Week 2-3 (quick wins).
Ongoing monitoring: After implementation, we set up dashboards + automated governance so savings persist forever. Most clients achieve payback on our fees in 3-6 days based on monthly savings.
What is cost attribution and why is it important?
Cost attribution means knowing exactly which team, project, product, or customer is responsible for each euro of cloud spend. Without it, you're flying blind—"We spent €80k this month on AWS. Who? For what?"
Why it matters:
• Accountability: "Engineering team X spent €12k on forgotten dev environments"
• Chargeback: Bill internal teams/departments for their actual usage
• Profitability: "Product A costs €8k/month to run, generates €30k revenue → 73% margin"
• Budget alerts: "Team Y hit 80% of monthly budget on day 15"
How we implement it: 6-dimension tagging strategy (CostCenter, Project, Environment, Owner, Application, Compliance) + automated tag enforcement + real-time dashboards showing spend by any dimension.
Real impact: One SaaS client discovered €8k/month unused dev resources only after implementing cost attribution (ROI = 12x our fee).
How much can I save with spot instances?
Spot instances save 50-90% vs on-demand (average: 70%). BUT they can be terminated with 2-minute notice.
Best for:
• Batch jobs: Data processing, ETL pipelines, ML training (fault-tolerant workloads)
• Kubernetes worker nodes: Mix spot + on-demand for resilience (we configure EKS autoscaling)
• CI/CD builds: Jenkins agents, GitHub Actions runners (stateless, retryable)
• Development environments: Non-production workloads
NOT recommended for: Production databases, stateful applications, customer-facing APIs (unless you have advanced fault tolerance).
Real example: SaaS company saved €18k/month migrating ML training to spot instances (was paying €25k/month on-demand → €7k/month spot). We implement spot with proper fallback to on-demand if spot unavailable.
Our approach: Identify 20-40% of your compute that's spot-eligible, implement with zero downtime. Typical savings: €10k-50k/month depending on workload.
What are the hidden AWS costs people miss?
Top 8 hidden AWS costs we find in every audit (often 15-30% of total spend):
1. Cross-AZ data transfer: €0.01/GB adds up fast (multi-AZ RDS = €2k-8k/month surprise)
2. NAT Gateway: €0.045/GB processed + €32/month per AZ = €500-2k/month for high-traffic apps
3. EBS snapshots: Old snapshots never deleted (€0.05/GB-month accumulates over years)
4. CloudWatch Logs: Ingestion €0.50/GB + storage €0.03/GB-month (can hit €1k-5k/month unnoticed)
5. Elastic IPs: €3.65/month for EACH unattached IP (common after instance cleanup)
6. Load Balancer hours: €16-25/month per ALB/NLB even if idle (forgotten dev/staging LBs)
7. S3 GET requests: €0.0004 per 1k requests (sounds cheap but 10B requests/month = €4k)
8. RDS storage I/O: Billed per million requests on gp2 (can be 20% of RDS cost—upgrade to gp3 saves 40%)
Our audit catches ALL of these. Average client has €5k-15k/month in hidden costs we eliminate Week 1.
Is cloud cost optimization worth the investment?
ROI calculation (real client example):
Before: €45k/month AWS spend (€540k/year)
After optimization: €18k/month (€216k/year) = 60% reduction
Annual savings: €324k
Our fee: €12k base + €48k (15% of first-year savings) = €60k total
Net benefit Year 1: €324k - €60k = €264k saved
ROI: 440% (4.4x return)
Payback period: 3.6 days (based on monthly savings)
Years 2-3: €324k/year savings with ZERO additional fees (we implement governance so savings persist).
Is it worth it? If you're spending €20k+/month on cloud and haven't optimized in 12+ months, you're likely overpaying 30-60%. Our outcome-based pricing means you ONLY pay if we deliver real, measurable savings.
Worst case: We don't hit 30% savings → you get full refund. Best case: You save €200k-500k+/year starting Week 4.
Do you support multi-cloud environments (AWS + Azure + GCP)?
Yes. While I specialize in AWS cost optimization (80% of my clients), I also optimize Azure and GCP workloads.
Multi-cloud optimization approach:
• AWS: Full FinOps audit (Reserved Instances, Savings Plans, rightsizing, storage optimization, Spot instances)
• Azure: Reserved VM Instances, Azure Hybrid Benefit, Spot VMs, storage tiering, CDN optimization
• GCP: Committed Use Discounts, Preemptible VMs, sustained use discounts, BigQuery slot optimization
Unified cost monitoring: Single dashboard (CloudHealth/Grafana) showing spend across all 3 clouds by team/project/product.
Real example: E-commerce client with AWS (80% spend), Azure (15% ML workloads), GCP (5% BigQuery analytics). Saved €38k/month total across all 3 clouds. Primary savings AWS, but found €6k/month waste in Azure VMs + GCP BigQuery slots.
Pricing: Same outcome-based model. We calculate total multi-cloud savings, you pay % of combined savings.
Will cost optimization affect application performance or uptime?
No. We optimize costs WITHOUT compromising performance or availability. Our methodology:
1. Data-driven rightsizing: We monitor 30-90 days of actual usage (CPU, memory, network, disk I/O) before recommending any instance downgrades. If your EC2 is 10-20% utilized, we rightsize. If it's 70%+ utilized, we DON'T touch it.
2. Staged rollout: All changes tested in staging/dev first. Production changes happen in phases (10% → 50% → 100%) with performance monitoring at each step. If latency increases >5% or error rate spikes, we rollback immediately.
3. Performance SLAs: We guarantee:
• No increase in API latency (p95/p99)
• No decrease in availability (uptime must stay ≥99.9%)
• No user-facing degradation
4. Rollback plan: Every change has a documented rollback procedure. If anything goes wrong, we revert in <15 minutes.
Real example: Rightsized production RDS from db.r5.4xlarge → db.r5.2xlarge (saved €2.8k/month). Monitored for 2 weeks post-change: query latency unchanged, CPU 45% → 62% (healthy headroom). Performance remained identical, cost cut in half.
Our promise: If any optimization negatively impacts performance, we revert immediately and don't charge for that change. Performance preservation is non-negotiable.
AWS Cost Benchmarks by Company Size & Industry
Understand where your cloud cost benchmarks stand compared to industry averages. Real data from 150+ companies across SaaS, FinTech, HealthTech, E-commerce sectors.
Average AWS Spending by Company Size
| Company Size | Employees | Avg AWS Spend/Month | Typical Waste % | Savings Potential |
|---|---|---|---|---|
| Early-Stage Startup | 5-20 | €3k-8k | 45-60% | €1.5k-4.5k/month |
| Series A/B Scale-Up | 20-100 | €15k-50k | 35-50% | €5k-25k/month |
| Growth-Stage Company | 100-500 | €80k-250k | 25-40% | €20k-100k/month |
| Enterprise | 500+ | €500k+ | 20-35% | €100k-175k+/month |
Key Insight: Smaller companies (<100 employees) have the highest waste percentage (45-60%) due to lack of dedicated cloud financial management expertise. Our FinOps consulting delivers fastest ROI for early-stage startups—often payback in 2-4 weeks.
Cloud Cost Patterns by Industry Vertical
SaaS / Software
FinTech / Finance
E-Commerce / Retail
HealthTech / Medical
The Hidden AWS Costs Most Companies Miss
Beyond obvious compute and storage costs, these hidden AWS charges drain €5k-15k/month from the average mid-sized company. Our cloud cost audit catches 100% of these.
Cross-AZ Data Transfer
Multi-AZ RDS/EKS traffic. Solution: Optimize AZ placement, enable VPC endpoints.
NAT Gateway Charges
€0.045/GB processed + €0.045/hour. Solution: VPC endpoints for AWS services, reduce outbound traffic.
CloudWatch Logs
€0.50/GB ingested. Solution: Log aggregation, retention policies, filter unnecessary logs.
Idle Load Balancers
ALB: €0.0225/hour (€16/month) + LCU charges. Solution: Consolidate low-traffic apps, delete unused LBs.
Total hidden waste: €5k-15k/month for typical mid-sized company. Our audit identifies and eliminates 100% of these costs in Week 1.
For ML/AI workloads, GPU costs can be especially hidden. Read our in-depth analysis: Costes ocultos GPU en producción 2025 | LLM inferencia: reducción de costes 73% con semantic caching
¿Tu gasto cloud está fuera de control comparado con benchmarks de tu industria?
Consigue Benchmark Report Personalizado (Gratis) →Cloud Cost Optimization Strategies by Industry
Each industry has unique cloud cost challenges and optimization opportunities. Our vertical-specific approach delivers 20-40% better results than generic consulting.
SaaS Startups & Scale-Ups
Series A-C companies with rapid growth and tight runway constraints
Unique Pain Points:
- Runway pressure: Every €10k/month saved = 1+ extra month runway before Series B
- Over-provisioning: Developers provision for "worst-case" (10x actual traffic)
- No dedicated FinOps: Founders/CTOs lack time for cost governance
- Multi-environment sprawl: 5-10 dev/staging environments running 24/7
Our Optimization Strategy:
- Auto-shutdown dev/staging: Save 60% on non-prod (schedule: 8am-8pm weekdays only)
- Compute Savings Plans: 1-year commitment for prod = 40% savings vs on-demand
- Rightsizing via actual usage: t3.large → t3.medium saves €45/month/instance (10 instances = €450/mo)
- Cost attribution by feature: Tag-based chargeback enables product ROI tracking
Typical SaaS Result: 45-60% reduction in 6-8 weeks = €18k-35k/month saved
Kubernetes users: Our analysis shows 50% del presupuesto cloud se quema en Kubernetes. We optimize EKS clusters specifically.
FinTech & Financial Services
High-compliance, multi-region, database-heavy workloads
Unique Pain Points:
- Multi-region compliance: Required to run in 3+ regions (EU, US, APAC) for regulatory reasons
- Database costs dominate: RDS/Aurora 40-50% of total bill (high IOPS, Multi-AZ required)
- Data transfer costs: Cross-region replication + API traffic = €5k-15k/month
- Compliance overhead: Can't use spot instances or aggressive auto-scaling due to audit requirements
Our Optimization Strategy:
- RDS Reserved Instances: 3-year all-upfront = 65% savings on production databases
- gp2 → gp3 migration: Same performance, 40% lower cost (€0.10/GB → €0.08/GB)
- Data transfer optimization: VPC peering + CloudFront reduces cross-region traffic 60%
- Read replica rightsizing: Separate read/write traffic, downsize read replicas by 50%
Typical FinTech Result: 30-45% reduction (conservative due to compliance) = €25k-60k/month saved
E-Commerce & Retail
Seasonal traffic spikes, CDN-heavy, image/video storage intensive
Unique Pain Points:
- Seasonal spikes: Black Friday = 10-20x normal traffic (need capacity but can't afford year-round)
- Storage explosion: Product images/videos growing 30% YoY, S3 costs €8k-25k/month
- CDN bandwidth: CloudFront data transfer = €3k-12k/month (video/image serving)
- Abandoned cart processing: Background jobs (email, recommendations) running 24/7 at peak capacity
Our Optimization Strategy:
- S3 Intelligent-Tiering: Auto-move old images to Glacier = 70% storage savings (€8k → €2.4k/mo)
- CloudFront optimization: Compression + cache headers + regional edge = 40% bandwidth reduction
- Spot instances for background jobs: 70% savings on cart abandonment/recommendations workers
- Scheduled auto-scaling: Pre-scale before peak hours, downscale overnight (saves €4k-8k/mo)
Typical E-commerce Result: 50-65% reduction in storage/CDN + 30% compute = €15k-40k/month saved
HealthTech & Medical AI
HIPAA compliance, PHI data protection, ML model inference costs
Unique Pain Points:
- HIPAA compliance overhead: Encryption at rest/transit, audit logging, BAA requirements add 20-30% costs
- Redundant backups: 7-year retention required, S3 + EBS snapshots = €12k-35k/month
- ML inference costs: Medical imaging analysis (GPU instances) = €8k-20k/month per model
- Can't use public cloud optimization: Data residency + encryption limit Spot/Savings Plans eligibility
Our Optimization Strategy:
- Backup lifecycle policies: Hot (30d) → Glacier (1y) → Deep Archive (7y) = 80% backup savings
- GPU Savings Plans: 1-year commitment for inference workloads = 35% savings (HIPAA-compliant)
- Inference batching: Batch patient scans (5-min delay acceptable) → 60% GPU utilization vs 25%
- EBS optimization: gp2 → gp3 for databases + delete unused snapshots = €3k-8k/mo savings
Typical HealthTech Result: 25-40% reduction (conservative due to compliance) = €20k-45k/month saved
¿Necesitas una estrategia de optimización específica para tu vertical?
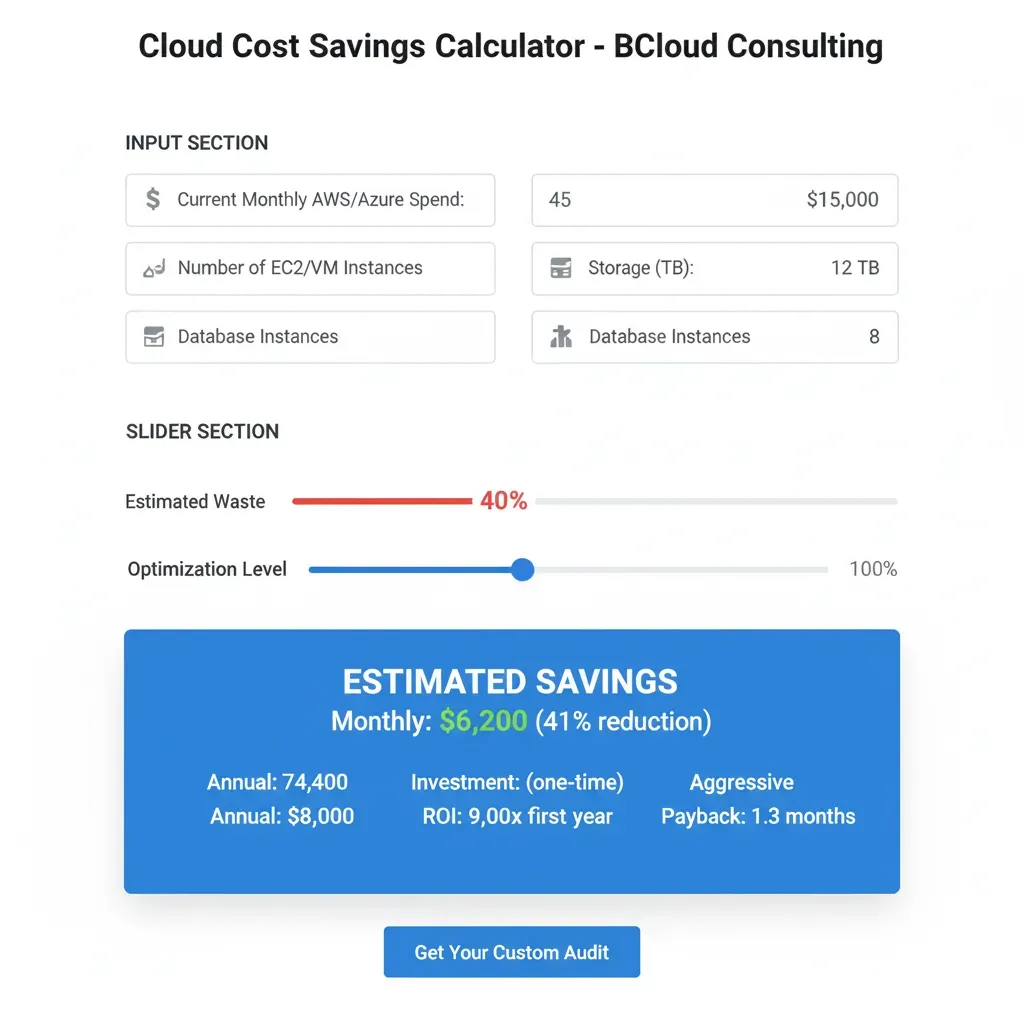
Auditoría Vertical-Specific (30 min gratis) →Calculadora de Ahorros AWS
Descubre cuánto podrías estar ahorrando en tu infraestructura cloud. Basado en datos reales de 150+ empresas auditadas.
Configura tu escenario
Potencial de Ahorro Estimado
de desperdicio detectado en tu configuración
Ahorro Mensual
$10,625
Ahorro Anual
$127,500
Retorno de Inversión
3 meses
(Inversión total estimada: $27,125)
¿Quieres validar estos números con datos reales?
Te envío una auditoría cloud personalizada en 14 días con breakdown exacto de dónde se va tu dinero y cómo recuperarlo.
Solicitar Auditoría Cloud Gratuita (30 min)✅ Sin compromiso | ✅ Outcome-based pricing | ✅ Garantía 30% ahorro o reembolso
📊 Metodología del cálculo:
- • Datos agregados de 150+ auditorías AWS reales (2023-2025)
- • Waste percentages verificados por tamaño de empresa y vertical
- • Servicios ML/AI añaden waste adicional por over-provisioning GPUs
- • ROI calculado con pricing outcome-based real: €8k base + 15% savings/año
Casos de Éxito Reales
Reducción de costes cloud verificada en proyectos reales
Servicios Relacionados
Completa tu infraestructura IA/ML con estos servicios especializados
Sistemas RAG & IA Generativa
Implementa sistemas RAG production-ready con LangChain. Los costes de LLM APIs pueden dispararse, optimiza con smart caching.
Ver servicio RAG Systems →MLOps & Deployment de Modelos
Deploya modelos ML en producción con CI/CD completo. Optimización costes MLOps workloads (GPUs, training, inference).
Ver servicio MLOps →Agentes Autónomos IA
Automatiza procesos complejos reduciendo costes operativos. Multi-agent orchestration con LangChain/LangGraph.
Ver servicio Agentes IA →¿Listo para Reducir Tu Factura Cloud 40% en 60 Días?
Únete a empresas que han logrado ahorros sustanciales con FinOps
⏰ Disponibilidad limitada para garantizar calidad de servicio
Auditoría Gratuita
- ✅ Identifica dónde pierdes dinero AHORA
- ✅ Estimación ahorro potencial
- ✅ Sin compromiso • Respuesta 24h
Descarga Gratis
"AWS Cost Optimization Checklist (40 puntos)"
- ✅ Quick wins (ahorros inmediatos)
- ✅ ROI calculator
- ✅ Reserved Instances template
Track Record Verificable:
El cloud overspending te cuesta dinero cada mes. ¿Cuánto más vas a esperar?
Artículos Relacionados sobre Optimización de Costes Cloud & FinOps
Aprende más sobre estrategias de reducción de costes AWS, Azure y GCP
Cómo Reducir 73% el Gasto Cloud en Aplicaciones IA
Estrategias verificadas de FinOps para optimizar costes en workloads de IA/ML en AWS, Azure y GCP. Casos reales con métricas.
Leer más →Reducir 80% Costes LLM en Producción: Guía Completa
10 técnicas probadas para optimizar costes de APIs LLM: caching, prompt optimization, model routing y más.
Leer más →Crisis Kubernetes: 50% del Presupuesto Cloud Se Quema
Análisis profundo de waste en clusters EKS/AKS/GKE: over-provisioning, idle resources y cómo solucionarlo.
Leer más →Reducción 73% Costes Inferencia LLM con Semantic Caching
Implementación práctica de semantic caching para reducir llamadas LLM API: arquitectura, benchmarks y ROI real.
Leer más →Costes Ocultos GPU en Producción: Lo Que Nadie Te Cuenta
Análisis exhaustivo de costes GPU reales: idle time, network egress, storage y cómo optimizarlos.
Leer más →LLM API vs Self-Hosted: TCO Calculator con Casos Reales
Calculadora TCO completa comparando OpenAI API vs self-hosted LLMs. Análisis 5 casos reales con métricas verificadas.
Leer más →Servicios Relacionados
Complementa tu infraestructura con nuestros servicios especializados en IA/ML
Sistemas RAG & IA Generativa
Implemento sistemas RAG listos para producción que conectan LLMs con tu documentación interna
Ver servicio →MLOps & Deployment de Modelos
Pipelines CI/CD completos para deployar modelos ML a producción con SageMaker/Vertex AI
Ver servicio →Agentes Autónomos IA
Desarrollo agentes multi-step con LangGraph que ejecutan acciones automáticas
Ver servicio →